- 注册时间
- 2009-2-12
- 最后登录
- 1970-1-1
- 威望
- 星
- 金币
- 枚
- 贡献
- 分
- 经验
- 点
- 鲜花
- 朵
- 魅力
- 点
- 上传
- 次
- 下载
- 次
- 积分
- 22525
- 在线时间
- 小时
|
 发表于 2017-3-17 10:31:19
|
显示全部楼层
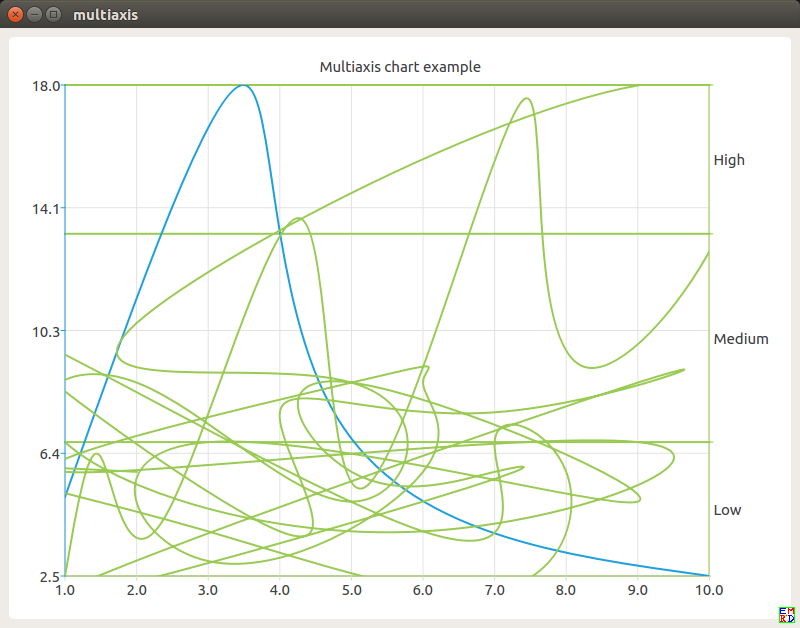
稍微改了下 Qt自带的例子Multiaxis chart example, 代码 路径是 /opt/Qt5.8.0/Examples/Qt-5.8/charts/multiaxis/
为了动态的画样条曲线, 我加了一个定时器,每次随机产生一个坐标点,添加到曲线里,并刷新.
截图如下, 应该还算很细腻清新的吧,  ,不比Mathematica丑: ,不比Mathematica丑:

- /****************************************************************************
- **
- ** Copyright (C) 2016 The Qt Company Ltd.
- ** Contact: https://www.qt.io/licensing/
- **
- ** This file is part of the Qt Charts module of the Qt Toolkit.
- **
- ** $QT_BEGIN_LICENSE:GPL$
- ** Commercial License Usage
- ** Licensees holding valid commercial Qt licenses may use this file in
- ** accordance with the commercial license agreement provided with the
- ** Software or, alternatively, in accordance with the terms contained in
- ** a written agreement between you and The Qt Company. For licensing terms
- ** and conditions see https://www.qt.io/terms-conditions. For further
- ** information use the contact form at https://www.qt.io/contact-us.
- **
- ** GNU General Public License Usage
- ** Alternatively, this file may be used under the terms of the GNU
- ** General Public License version 3 or (at your option) any later version
- ** approved by the KDE Free Qt Foundation. The licenses are as published by
- ** the Free Software Foundation and appearing in the file LICENSE.GPL3
- ** included in the packaging of this file. Please review the following
- ** information to ensure the GNU General Public License requirements will
- ** be met: https://www.gnu.org/licenses/gpl-3.0.html.
- **
- ** $QT_END_LICENSE$
- **
- ****************************************************************************/
- #include <QtWidgets/QApplication>
- #include <QtWidgets/QMainWindow>
- #include <QtCharts/QChartView>
- #include <QtCharts/QLineSeries>
- #include <QtCharts/QSplineSeries>
- #include <QtCharts/QValueAxis>
- #include <QtCharts/QCategoryAxis>
- #include <QTimer>
- #include <QTime>
- QT_CHARTS_USE_NAMESPACE
- int main(int argc, char *argv[])
- {
- QApplication a(argc, argv);
- //![1]
- QChart *chart = new QChart();
- chart->legend()->hide();
- chart->setTitle("Multiaxis chart example");
- //![1]
- //![2]
- QValueAxis *axisX = new QValueAxis;
- axisX->setTickCount(10);
- chart->addAxis(axisX, Qt::AlignBottom);
- //![2]
- //![3]
- QSplineSeries *series = new QSplineSeries;
- *series << QPointF(1, 5) << QPointF(3.5, 18) << QPointF(4.8, 7.5) << QPointF(10, 2.5);
- chart->addSeries(series);
- QValueAxis *axisY = new QValueAxis;
- axisY->setLinePenColor(series->pen().color());
- chart->addAxis(axisY, Qt::AlignLeft);
- series->attachAxis(axisX);
- series->attachAxis(axisY);
- //![3]
- //![4]
- series = new QSplineSeries;
- *series << QPointF(1, 0.5) << QPointF(1.5, 4.5) << QPointF(2.4, 2.5) << QPointF(4.3, 12.5)
- << QPointF(5.2, 3.5) << QPointF(7.4, 16.5) << QPointF(8.3, 7.5) << QPointF(10, 17);
- chart->addSeries(series);
- QCategoryAxis *axisY3 = new QCategoryAxis;
- axisY3->append("Low", 5);
- axisY3->append("Medium", 12);
- axisY3->append("High", 17);
- axisY3->setLinePenColor(series->pen().color());
- axisY3->setGridLinePen((series->pen()));
- chart->addAxis(axisY3, Qt::AlignRight);
- series->attachAxis(axisX);
- series->attachAxis(axisY3);
- //![4]
- //![5]
- QChartView *chartView = new QChartView(chart);
- chartView->setRenderHint(QPainter::Antialiasing);
- //![5]
- QTimer *timer = new QTimer(chart);
- qsrand(QTime::currentTime().second());
- QObject::connect(timer,&QTimer::timeout,[=]() {
- *series<<QPointF(qrand()%10,qrand()%10);
- chartView->update();
- });
- timer->start(100);
- //![6]
- QMainWindow window;
- window.setCentralWidget(chartView);
- window.resize(800, 600);
- window.show();
- //![6]
- return a.exec();
- }
|
|